
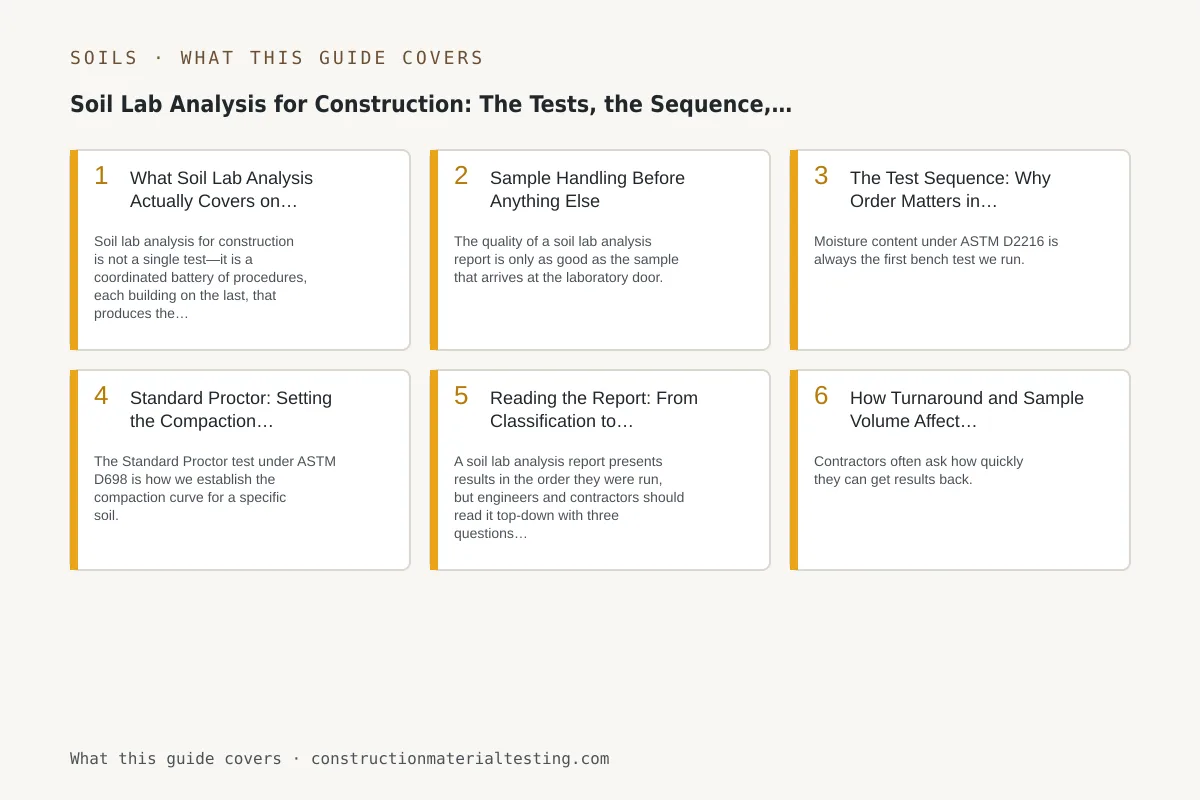
What Soil Lab Analysis Actually Covers on a Construction Project
Soil lab analysis for construction is not a single test—it is a coordinated battery of procedures, each building on the last, that produces the index and performance properties an engineer needs to specify fill compaction, evaluate subgrade support, and select a foundation type. On most projects in the Gulf Coast region, the standard battery includes moisture content, Atterberg limits, particle-size distribution, Standard Proctor compaction, and USCS classification. Depending on the scope, a geotechnical engineer may also call for consolidation, unconfined compression, or other specialized testing, but the five listed tests form the backbone of nearly every routine geotechnical investigation.
Understanding the purpose of each test—and the order in which they must run—helps contractors and owners interpret the final report rather than treating it as a black box. It also helps project teams ask the right questions when results fall outside expected ranges, which happens often with the expansive clays common across the Houston metro and throughout much of South Texas.
Sample Handling Before Anything Else
The quality of a soil lab analysis report is only as good as the sample that arrives at the laboratory door. Moisture-sensitive tests—particularly Atterberg limits and moisture content—can be skewed irreversibly if a sample dries out in transit or absorbs moisture from a leaking container. We require that disturbed samples be sealed in complete bags or jars immediately after retrieval in the field, labeled with boring number, sample depth, date, and project identifier, and placed in a cooler or shaded location until pickup or delivery. Undisturbed Shelby tube samples require end caps sealed with wax or plastic caps and should remain upright during transport.
Chain-of-custody documentation travels with the samples. This is not bureaucratic overhead—it is the mechanism that ties laboratory results to a specific location and depth on a boring log. When a geotechnical engineer reviews the data, they must be able to correlate every test result to where in the subsurface the material came from. Breaks in documentation create ambiguity that can delay report issuance or, worse, require resampling. We log sample condition at receipt—any obvious disturbance, cracked tubes, or partially dried material is noted before testing begins.
The Test Sequence: Why Order Matters in Soil Lab Analysis
Moisture content under ASTM D2216 is always the first bench test we run. We weigh the sample as received, dry it in an oven at 110 ± 5 °C, and weigh it again. The difference expressed as a percentage of dry mass is the natural moisture content—a value the geotechnical engineer uses to assess in-situ conditions and that the laboratory needs before any specimen is disturbed further. Once a sample is oven-dried it cannot be reliably restored to its natural state, so the natural moisture reading must come first.
Atterberg limits under ASTM D4318 follow. The liquid limit is the moisture content at which a soil transitions from plastic to liquid behavior; the plastic limit is the lower boundary of plastic behavior. Their difference is the plasticity index, or PI. These values are the primary descriptors of fine-grained soil behavior. High-PI clays shrink and swell aggressively with moisture change—a critical concern for slab-on-grade foundations and pavement subgrades across the Beaumont, Houston, and Victoria clay belts. A PI above 20 in a subgrade material typically triggers additional stabilization analysis.
Particle-size distribution under ASTM D6913 uses a stack of standard sieves to separate the coarse fraction and, when combined with hydrometer analysis under ASTM D7928, characterizes the fine fraction as well. Gradation data tells us what percentage of a soil is gravel, sand, silt, and clay by mass, and whether the material is well-graded, gap-graded, or uniformly graded. For granular fills, gradation alone often drives acceptance or rejection against a specification gradation band.
With moisture content, Atterberg limits, and gradation in hand, we classify the soil under ASTM D2487—the Unified Soil Classification System. USCS assigns a two-letter symbol (CL, CH, SC, SM, GP, and so on) and a group name that communicates the soil's engineering behavior to anyone who reads the report. Classification is a derived result, not a measured one; it cannot be reported until the input tests are complete.
Standard Proctor: Setting the Compaction Benchmark
The Standard Proctor test under ASTM D698 is how we establish the compaction curve for a specific soil. We prepare specimens at several moisture contents, compact each with a prescribed drop hammer and number of blows per layer, and plot dry density against moisture content. The peak of the resulting curve is the maximum dry density (MDD), and the moisture at that peak is the optimum moisture content (OMC). These two numbers become the target reference for field compaction inspection.
When a field technician runs a nuclear density gauge or sand cone test on a compacted lift, they are comparing the achieved in-place dry density to the laboratory MDD. A specification requiring 95 percent of Standard Proctor MDD means that field density must reach at least 95 percent of the laboratory value at a moisture content within a defined range—typically OMC minus 2 to OMC plus 2 percentage points, though project specifications vary. Without the laboratory Proctor curve, the field reading is a number without context. The Proctor is not optional on any engineered fill project. For information on how this testing fits into a broader site-testing program in the Houston region, see our overview of soil testing services for Houston-area projects.
One practical note: the Proctor must be run on representative, unaltered material. If the fill source changes mid-project—a different borrow pit, a different quarry blend—a new Proctor is required. Using an old curve for a different material is a quality-control failure that no field density test can catch on its own.
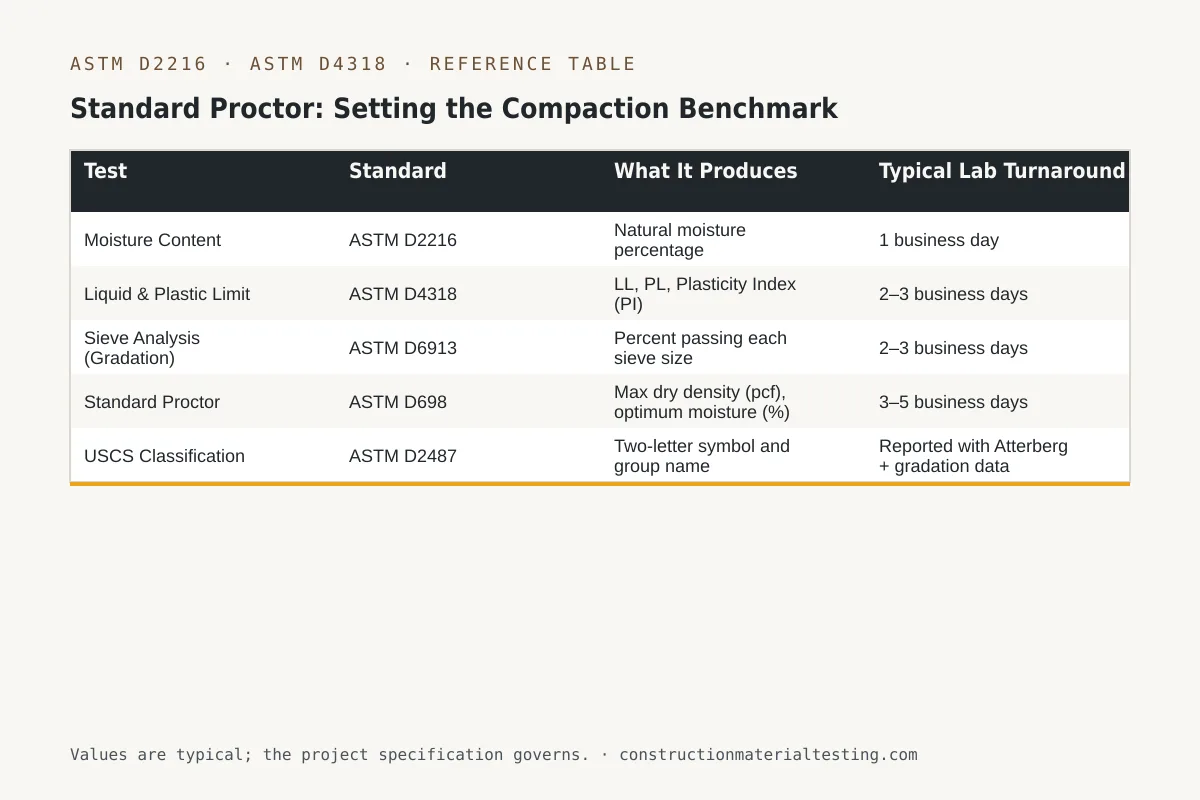
| Test | Standard | What It Produces | Typical Lab Turnaround |
|---|---|---|---|
| Moisture Content | ASTM D2216 | Natural moisture percentage | 1 business day |
| Liquid & Plastic Limit | ASTM D4318 | LL, PL, Plasticity Index (PI) | 2–3 business days |
| Sieve Analysis (Gradation) | ASTM D6913 | Percent passing each sieve size | 2–3 business days |
| Standard Proctor | ASTM D698 | Max dry density (pcf), optimum moisture (%) | 3–5 business days |
| USCS Classification | ASTM D2487 | Two-letter symbol and group name | Reported with Atterberg + gradation data |
Reading the Report: From Classification to Field Action
A soil lab analysis report presents results in the order they were run, but engineers and contractors should read it top-down with three questions in mind: What is this material? How does it compact? And is it suitable for the intended use? The USCS classification answers the first question. A CH (fat clay) in the subgrade zone means high shrink-swell potential, poor drainage, and likely the need for lime or cement stabilization before paving or slab placement. A SW (well-graded sand) in the same location is a fundamentally different condition—stable, free-draining, and generally easy to compact.
The Proctor data answers the second question. Tight compaction curves with a sharp peak are typical of well-graded coarse materials and are relatively forgiving in the field. Flat, broad curves—common with silty soils—indicate that dry density is less sensitive to moisture variation, which sounds convenient but can mask poor compaction at field densities that technically pass the percentage requirement. Experienced project engineers read the curve shape, not just the peak numbers.
The third question—suitability—is where the geotechnical engineer and the project specifications take over. Fill specifications for a structural embankment may exclude any material with PI greater than a threshold value, or may limit the maximum particle size, or may require a minimum percentage passing a particular sieve. The laboratory report does not make that judgment call; it supplies the data so the engineer can. If laboratory results show the proposed fill source does not meet specification, the contractor must either treat the soil, blend it with other material, or find an alternative borrow source—and run the lab battery again on the revised material.
How Turnaround and Sample Volume Affect Your Schedule
Contractors often ask how quickly they can get results back. For most of the individual tests, moisture content is available in one business day; Atterberg limits and gradation take two to three business days; a Standard Proctor typically requires three to five business days because each point on the compaction curve requires a separate specimen preparation and compaction cycle. Classification is reported alongside the Atterberg and gradation data. For projects in the Houston metro area, we can often accommodate tighter timelines on moisture content and gradation; turnaround for laboratories serving regional dispatch hubs outside the immediate Houston area follows standard scheduling.
Sample volume is a constraint that field crews sometimes underestimate. A Standard Proctor on a coarse-grained soil may require up to 35 kg of material per ASTM D698 requirements. If the submitted sample is short, we contact the submitting party before testing rather than running a nonconforming specimen. Sending adequate, representative samples the first time avoids delays that cascade into pour holds or failed lift acceptance. The ASCE Geo-Institute publishes guidance on sampling practice and quality standards that complement ASTM method requirements and are worth reviewing for teams setting up field sampling protocols.
Where Soil Lab Analysis Fits on Your Project
Whether the test results are being used to characterize native subgrade before a pavement section is designed, verify that imported fill meets specification, or give a structural engineer the data needed to size a shallow foundation, soil lab analysis is the factual foundation of every decision that follows. Results that are ambiguous—because samples were poorly preserved, the wrong test was ordered, or the sequence was skipped—force engineering assumptions that are conservative by necessity and expensive in practice.
We work with geotechnical engineers, general contractors, and owners directly from sample submission through final report, and we can help determine which tests a project actually needs before samples are collected. If you are at the stage of planning a soils investigation or need to establish a compaction specification for an upcoming fill operation, submit a proposal request and we will work through the scope with you.
Get our guides in your Google results
Add Construction Materials Testing as a preferred source and Google shows our guides more often when you search for testing topics.