

What the Proctor Test Actually Measures
The proctor test establishes a relationship between a soil's water content and the dry density it achieves when compacted under a defined energy level in a laboratory mold. The result is a compaction curve—sometimes called a moisture-density curve—that peaks at a specific water content called the optimum moisture content (OMC) and a corresponding maximum dry density (MDD). Those two numbers become the reference values against which field compaction is judged. Without a reliable lab curve, a field nuclear gauge reading or sand-cone test has no benchmark to compare against.
The physics behind the curve are straightforward. At very low moisture contents, soil particles are held together by capillary tension and friction, and the soil resists rearrangement. As water is added it lubricates particle contacts, allowing grains to slide into a denser packing. Beyond the optimum point, additional water occupies void space that would otherwise be filled with solid particles, and density drops off. The curve shape—flat on the dry side, steep on the wet side in many soils—is a consistent signature that tells experienced technicians a lot about soil behavior before a single field test is run.
Because the lab energy must bear some relationship to field roller energy to produce useful compaction specifications, engineers have standardized two distinct test procedures. Understanding what separates them is essential before any earthwork specification is written or interpreted. Our soil testing services page outlines where the Proctor test fits within a broader geotechnical testing program.
Compactive Energy: The Core Difference Between ASTM D698 and D1557
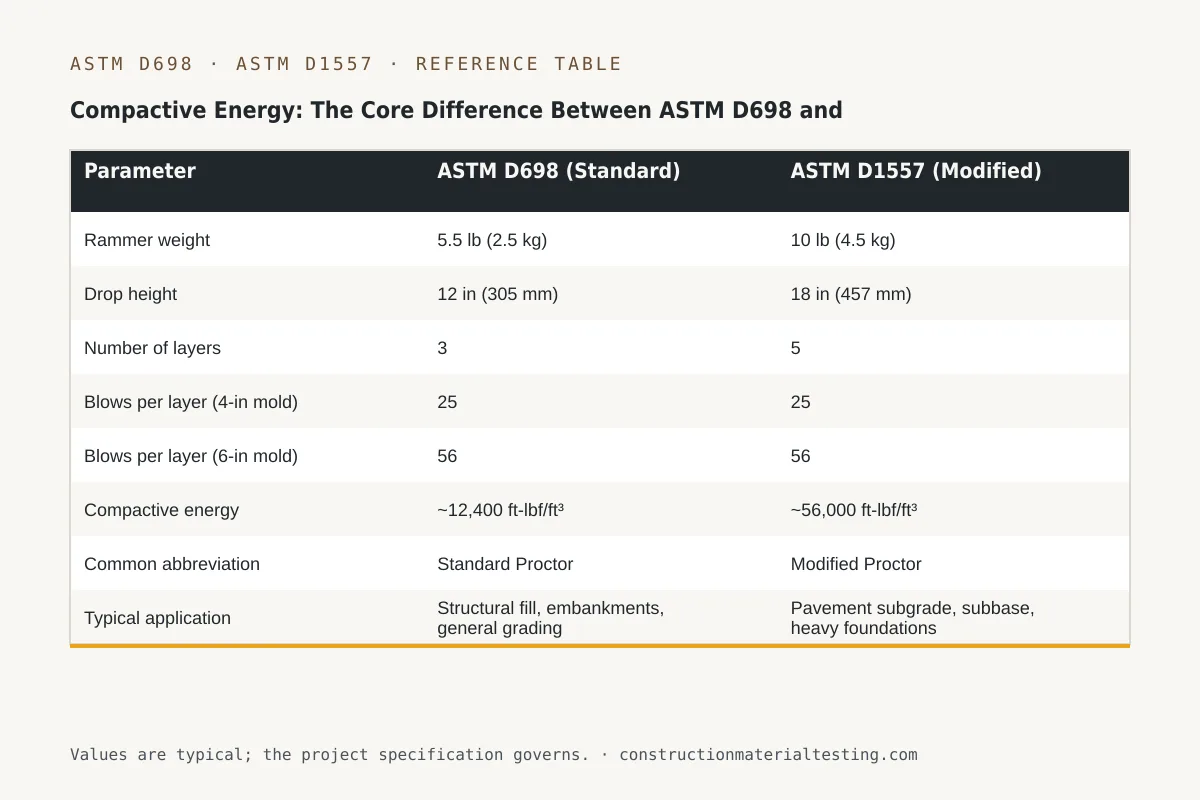
ASTM D698—the Standard Proctor—was developed in the 1930s to approximate the energy delivered by early field compaction equipment. The procedure uses a 5.5-lb rammer dropped 12 inches over 25 blows per layer for three layers in a 4-inch mold, or 56 blows per layer for three layers in a 6-inch mold. The resulting compactive energy is approximately 12,400 ft-lbf/ft³.
ASTM D1557—the Modified Proctor—was developed during World War II for airfield subgrade design, where heavier aircraft demanded better-compacted soils. The procedure uses a 10-lb rammer dropped 18 inches over 25 blows per layer for five layers in a 4-inch mold, or 56 blows per layer for five layers in a 6-inch mold. The resulting compactive energy is approximately 56,000 ft-lbf/ft³—roughly 4.5 times greater than the Standard Proctor. That energy difference is not a minor refinement; it fundamentally changes both the shape and position of the compaction curve.
Because Modified Proctor energy is higher, it drives more moisture out of the pore structure and forces particles into a denser arrangement at a lower water content. A soil that has a Standard Proctor OMC of 14 percent and MDD of 112 pcf might show an OMC of 10 percent and MDD of 121 pcf under Modified Proctor energy. If a specification requires 95 percent of Modified Proctor MDD but the lab report was run to D698, the project is either over-compacting unknowingly or accepting material that would fail a correct comparison. See the full procedure details for ASTM D698 and ASTM D1557 on our test method pages.
The technical requirements for each standard are published and maintained by ASTM International. Reviewing the official ASTM D698 standard and ASTM D1557 standard directly gives engineers the tolerance tables and apparatus specifications needed for procurement and QA plan writing.
| Parameter | ASTM D698 (Standard) | ASTM D1557 (Modified) |
|---|---|---|
| Rammer weight | 5.5 lb (2.5 kg) | 10 lb (4.5 kg) |
| Drop height | 12 in (305 mm) | 18 in (457 mm) |
| Number of layers | 3 | 5 |
| Blows per layer (4-in mold) | 25 | 25 |
| Blows per layer (6-in mold) | 56 | 56 |
| Compactive energy | ~12,400 ft-lbf/ft³ | ~56,000 ft-lbf/ft³ |
| Common abbreviation | Standard Proctor | Modified Proctor |
| Typical application | Structural fill, embankments, general grading | Pavement subgrade, subbase, heavy foundations |
Proctor Test Methods A, B, and C—Choosing the Right Mold and Fraction
Both D698 and D1557 offer three test methods that differ in mold size and the particle-size fraction of soil tested. Method A uses a 4-inch-diameter mold and tests material passing the No. 4 sieve. Method B uses a 4-inch mold and tests material passing the 3/8-inch sieve. Method C uses a 6-inch mold and tests material passing the 3/4-inch sieve. Each method is appropriate for a different gradation, and selecting the wrong one introduces systematic error.
Method A is by far the most commonly specified and encountered in routine earthwork testing across the Gulf Coast region. It applies when 20 percent or less of the total sample is retained on the No. 4 sieve. If the retained fraction is between 20 and 30 percent, Method B may be used. When more than 30 percent is retained on the 3/4-inch sieve, Method C becomes necessary, and oversize correction also enters the picture. The method used in the laboratory must be recorded on every test report so that field inspectors can confirm the comparison is apples to apples.
One practical complication: the specification may call for a method without accounting for the actual gradation of the delivered fill material. If a spec was written for a clay subgrade and the contractor substitutes a sandy gravel, the testing laboratory should flag the mismatch rather than silently switch methods. Our materials testing services group routinely coordinates with the geotechnical engineer of record when soil gradations fall outside the assumed method.
Reading the Compaction Curve: Shape, Slope, and What Can Go Wrong
A well-constructed Proctor curve has a smooth, roughly parabolic shape with a clearly defined peak. Technicians plot at least four to five points—each at a different water content—to define the curve reliably. Plotting only three points is technically possible but risky: if one point is an outlier, there is not enough data to recognize it, and the fitted peak can shift significantly. We prefer five points whenever sample availability allows it.
The dry side of the curve—to the left of the OMC—tends to be gentler in granular soils and steeper in plastic clays. The wet side drops off more steeply in almost all soils because water is essentially incompressible and occupies the space that would otherwise hold solid material. A flat, broad peak suggests a soil is relatively forgiving of moisture variation in the field, while a sharp, narrow peak indicates that the contractor must control moisture tightly to stay within the specified range.
Common curve anomalies that a qualified technician should catch before the report leaves the lab include a double-peaked curve, which often signals that two different soils were tested or that sample reuse contaminated a data point; a curve that never turns back down on the wet side, which typically means the soil was not wetted sufficiently to reach the wet side; and a point plotting above or to the right of the zero-air-voids line, which is physically impossible and indicates a measurement or calculation error in that data point.
Sample reuse is a persistent quality issue. Both D698 and D1557 allow reuse of previously compacted material under certain conditions, but reuse is never appropriate for highly plastic clays or for soils containing significant organic content, because repeated compaction and drying changes particle structure and produces falsely high density values. Our laboratory quality system requires technicians to document whether reuse was employed and to obtain a fresh increment for any point that looks anomalous.
The Zero-Air-Voids Line and What It Tells You
Every Proctor test report worth reviewing includes a zero-air-voids (ZAV) curve plotted alongside the compaction curve. The ZAV line represents the theoretical dry density at which all voids in the soil are filled with water and no air remains—the absolute maximum density achievable at a given water content for a material with a specific specific gravity. It is calculated from the relationship between dry density, water content, and specific gravity of solids. The curve slopes downward from left to right: as moisture content increases, the theoretical maximum dry density decreases because water is displacing solid mass on a volume basis.
The practical value of the ZAV line is as a quality check, not a target. A properly run Proctor curve should have its peak falling below and to the left of the ZAV line, typically at a degree of saturation somewhere between 75 and 95 percent at the optimum point, depending on soil type. The closer the peak sits to the ZAV curve, the more saturated the soil is at optimum—fine-grained, plastic soils often peak at higher saturation than coarse-grained, granular ones.
If any plotted Proctor data point falls to the right of or on the ZAV line, something is wrong: the specific gravity used in the calculation may be incorrect, the mass or volume measurement of the mold may have an error, or the water content determination was inaccurate. Technicians should catch this during data review, not after the report is signed. For nuclear gauge density testing in the field, the same ZAV relationship provides a sanity check on field readings, an intersection we discuss in our overview of ASTM D6938 nuclear gauge testing.
Oversize Correction: When ASTM D4718 Applies
Field fills frequently contain gravel and rock fragments larger than the No. 4, 3/8-inch, or even 3/4-inch sieves. The Proctor mold is too small to test material of that size directly—large particles would bridge across the mold and produce meaningless results. ASTM D4718 provides the correction procedure for adjusting a Proctor test result obtained on the minus-sieve fraction back to a value representative of the total in-place material.
The correction works by accounting for the volume and mass that the oversize particles would occupy in the compacted mass. The procedure requires measuring the fraction retained on the applicable sieve, determining its bulk specific gravity (typically using ASTM D7, C127, or equivalent), and applying the volumetric correction equations given in D4718. The corrected MDD is always higher than the MDD of the fines fraction alone, because coarse particles generally have a higher specific gravity than the soil matrix, and the corrected OMC is always lower.
The trigger for mandatory correction in most project specifications is when more than 25 percent of the total sample by dry mass is retained on the No. 4 sieve, though some specifications set the threshold at 30 percent. When the oversize fraction exceeds about 40 percent, the correction equations become less reliable because the fine-fraction matrix no longer controls compaction behavior—the coarse skeleton does—and the geotechnical engineer should be consulted about an alternative approach.
A common field problem is that the contractor's borrow material changes gradation from day to day as different areas of the borrow pit are excavated. An oversize correction computed on a sample from Day 1 may not represent Day 14 material. Establishing a frequency for resampling and re-running the Proctor with oversize correction is part of a sound compaction quality control plan. Coordination with the materials testing team before earthwork begins prevents arguments about whose Proctor curve governs.
Which Specifications Call for D698 vs D1557?
The choice of Standard versus Modified Proctor is not the testing laboratory's decision—it is set by the project specification, which in turn should reflect the geotechnical engineer's assessment of what compaction level is needed for the intended use. In practice, there are recognizable patterns. General structural fill beneath slabs-on-grade and embankments not subject to heavy repeated loading are commonly specified to 95 percent of Standard Proctor MDD per ASTM D698. Pavement subgrades, subbase layers, and fills beneath spread footings carrying significant structural load are more often specified to 95 or 98 percent of Modified Proctor MDD per ASTM D1557.
TxDOT specifications, which govern a large share of highway and public infrastructure work in Texas, generally reference Modified Proctor energy for roadway applications. The Texas Department of Transportation's standard specifications call out density requirements relative to Modified Proctor for flexible base and treated subgrade layers. Local municipal specifications in the Houston metro vary: some jurisdictions default to Standard Proctor for residential utility backfill, while others have adopted Modified Proctor for all right-of-way work. Reading the actual specification language—not relying on memory—is the only safe approach.
IBC Section 1705 special inspection requirements for fill placement trigger continuous or periodic inspection by a qualified special inspector, and the inspection records must reference the correct Proctor standard. When the geotechnical report specifies D1557 and the special inspector's field report logs density as a percentage of D698 MDD, the documentation does not satisfy the intent of the inspection requirement even if the numbers look acceptable. ACI 318 does not govern earthwork directly, but the concrete foundation design it covers depends on the subgrade meeting the compaction density assumed by the geotechnical engineer—making the Proctor standard selection consequential for the entire structural system.
For building pad certifications in Texas, the geotechnical report typically prescribes both the Proctor standard and the minimum percent compaction required at each lift. If a change in fill source occurs mid-project, a new Proctor test is required before field densities can continue to be compared. Running field tests without an updated lab curve is a common deficiency we observe during third-party QA audits.
| Application | Typical Standard | Common Minimum Compaction | Notes |
|---|---|---|---|
| General structural fill (light loading) | ASTM D698 | 95% | Verify with geotech report |
| Residential slab subgrade | ASTM D698 or D1557 | 95–98% | Varies by jurisdiction and engineer |
| Pavement subgrade (highway) | ASTM D1557 | 95–98% | TxDOT and local specs vary by layer |
| Flexible base / subbase | ASTM D1557 | 95–100% | TxDOT Item 247 references Modified |
| Utility trench backfill (ROW) | ASTM D1557 | 95% | Many municipalities specify Modified |
| Embankment (non-structural) | ASTM D698 | 90–95% | Lower requirement acceptable for mass fill |
| Fill beneath spread footings | ASTM D1557 | 95–98% | Geotech typically mandates Modified |
Running the Test: Step-by-Step Procedure and Critical Controls
Both D698 and D1557 follow the same procedural skeleton. The sample is dried or air-dried to a starting moisture content well below the expected OMC. Water is then added incrementally—typically in 2-percent steps—and the soil is mixed thoroughly in a pan before each compaction point. The mold is assembled, the collar attached, and the soil is compacted in the specified number of layers using the appropriate rammer. After compaction, the collar is removed, the surface is struck off flush, the mold and soil are weighed, and a moisture content sample is taken from the interior of the compacted plug.
Critical controls that separate a reliable Proctor from a sloppy one include consistent blow pattern, consistent rammer drop height, complete layer coverage with blows distributed uniformly across the mold face rather than concentrated in the center, and representative moisture content sampling. The moisture content sample must come from the interior of the compacted specimen—not from the struck-off trimmings—because surface evaporation during compaction can make trim material drier than the interior.
Oven-drying the moisture content sample is the reference method. Microwave drying is sometimes used for rapid turnaround, but it can over-dry fine-grained soils and is not acceptable when the test report will be used for specification compliance without verification. Calcium carbide gas pressure (Speedy) methods are acceptable for field moisture content but are not equivalent to the oven-dry procedure for establishing the Proctor curve itself.
The mold volume must be verified periodically. A mold that has been dropped, dented, or machined down for re-surfacing may no longer hold the nominal volume, and a volume error of even one percent propagates directly into a dry density error of the same magnitude. Our lab measures mold volume at defined intervals under our quality system and records the calibration. Any mold with a volume outside tolerance is taken out of service.
Edge Cases and When the Standard Procedure Breaks Down
Organic soils, highly plastic clays, and materials with significant cementing present challenges that the standard Proctor procedure does not fully address. Organic content reduces specific gravity and makes density calculations unreliable if a standard Gs assumption is used. The ASTM D698 and D1557 procedures note that soils with organic content may require special treatment, and some project specifications explicitly exclude the use of organic material as structural fill regardless of what a Proctor curve might show. When organic content is suspected, a loss-on-ignition or organic content test should run alongside the Proctor.
Lime-treated and cement-treated soils develop pozzolanic bonds over time. Compacting treated material hours after mixing produces a different curve than compacting immediately after mixing, and repeated compaction of the same material batch breaks down the early cementitious bonds and falsely elevates the measured density. For treated soils, the Proctor test should be run within a defined time window after treatment—typically within one to two hours, depending on the stabilizer type and ambient temperature—and sample reuse is never acceptable.
In hot weather—a persistent factor across South Texas and the Gulf Coast—evaporation during sample preparation and compaction can shift the moisture content of a point by 0.5 to 1 percent without the technician realizing it. Covering prepared specimens with damp burlap or plastic sheeting between compaction increments is a basic control measure. For very fine-grained soils with slow drainage, the equilibration time after adding water also matters: insufficient mixing time produces a curve that appears to flatten out on the wet side because the water has not fully redistributed through the sample.
Finally, gap-graded soils—those with a bimodal particle size distribution and a missing intermediate fraction—frequently produce irregular compaction curves with multiple inflection points or an indistinct peak. These soils may require a larger mold under Method C, more data points per curve, or consultation with the geotechnical engineer before a single OMC and MDD are reported for specification use.
Connecting Lab Curves to Field Density Testing
A Proctor test is meaningless in isolation. Its value exists entirely in its relationship to field density tests—nuclear gauge readings per ASTM D6938, sand-cone tests per ASTM D1556, or rubber-balloon tests per ASTM D2167. The field test measures the in-place dry density of a compacted lift. The Proctor test provides the maximum dry density against which that field measurement is expressed as a percentage. Percent compaction equals in-place dry density divided by Proctor MDD, multiplied by 100.
The two tests must reference the same standard and the same method. A field density taken on a 6-inch lift of sandy fill cannot be correctly evaluated against a Proctor run on the minus-3/4-inch fraction of a different batch of material without documenting that the gradation of field material matches the tested fraction. When fill sources change, or when the inspector observes that delivered material looks different from the material on which the Proctor was run, a new Proctor test is required. Running a new curve mid-project is not a disruption—it is the correct response to changing conditions.
Field nuclear gauge tests measure wet density and moisture content electronically and compute dry density internally. The gauge must be calibrated using a standard count procedure at the start of each day and is periodically checked against a reference standard. Systematic gauge drift, surface roughness effects, and chemical composition differences between the calibration material and the actual soil can all introduce bias. When field densities consistently plot near or above 100 percent of a Modified Proctor MDD, that is worth questioning: is the soil genuinely well-compacted, or is the gauge reading high relative to the curve? Periodic correlation with sand-cone tests is a useful check. More detail on gauge operation and calibration is available on our ASTM D6938 test method page.
Where This Fits on Your Project
Whether you are establishing a compaction specification for a new project, verifying that an existing spec references the right Proctor standard, or troubleshooting density failures in the field, the starting point is always the laboratory Proctor curve. Getting it right—right method, right energy level, right oversize correction, right moisture control in the lab—is not a formality. It is the foundation of every percent-compaction value your inspector will record and every lift acceptance decision your project will make.
Our field desk and laboratory team support earthwork compaction programs across the Houston metro and through our regional dispatch hubs. We coordinate Proctor testing, oversize correction, and field density programs as integrated services, and our NICET- and ACI-certified technicians can review existing lab reports to flag method mismatches or curve anomalies before they become a documentation problem at project closeout. If you are scoping testing services for an upcoming project or need a second opinion on a flagged density report, submit a proposal request and we will get the right people looking at it.
Get our guides in your Google results
Add Construction Materials Testing as a preferred source and Google shows our guides more often when you search for testing topics.