

What the Atterberg Limits Test Actually Measures
The atterberg limits test, codified in ASTM D4318, is a set of two boundary measurements run on the fraction of a soil passing the No. 40 sieve. That fraction—fine sand, silt, and clay—is the part of a soil that changes behavior dramatically as its water content rises or falls. The test draws two specific water-content thresholds: the liquid limit (LL) and the plastic limit (PL). The difference between them is the plasticity index (PI), and PI is the number that shows up in nearly every fill specification, subgrade acceptance criterion, and stabilization design you will encounter on a project in this region.
The concept behind the test goes back to Albert Atterberg, a Swedish scientist who recognized in the early twentieth century that fine-grained soils pass through distinct behavioral states as they dry from a slurry to a crumbly solid. Those states—liquid, plastic, semi-solid, and solid—are separated by water-content boundaries. Modern geotechnical practice cares most about the liquid-to-plastic and plastic-to-semi-solid transitions, because that range of water content is where soils are most commonly placed and compacted in the field. Understanding those limits tells an engineer how forgiving or unforgiving a soil will be to moisture fluctuations once it is in service.
A high PI means the soil has a wide range of water content over which it behaves plastically—it can absorb a lot of water before it loses shear strength, and it can also shrink dramatically as it dries. A low or non-plastic result means the soil is relatively insensitive to moisture changes. Most of the expansive clays common across the Texas Gulf Coast and Houston suburbs sit on the high end of that spectrum, which is precisely why geotechnical services in this region so frequently include Atterberg limits as a baseline characterization test.
How We Run the Liquid Limit Portion
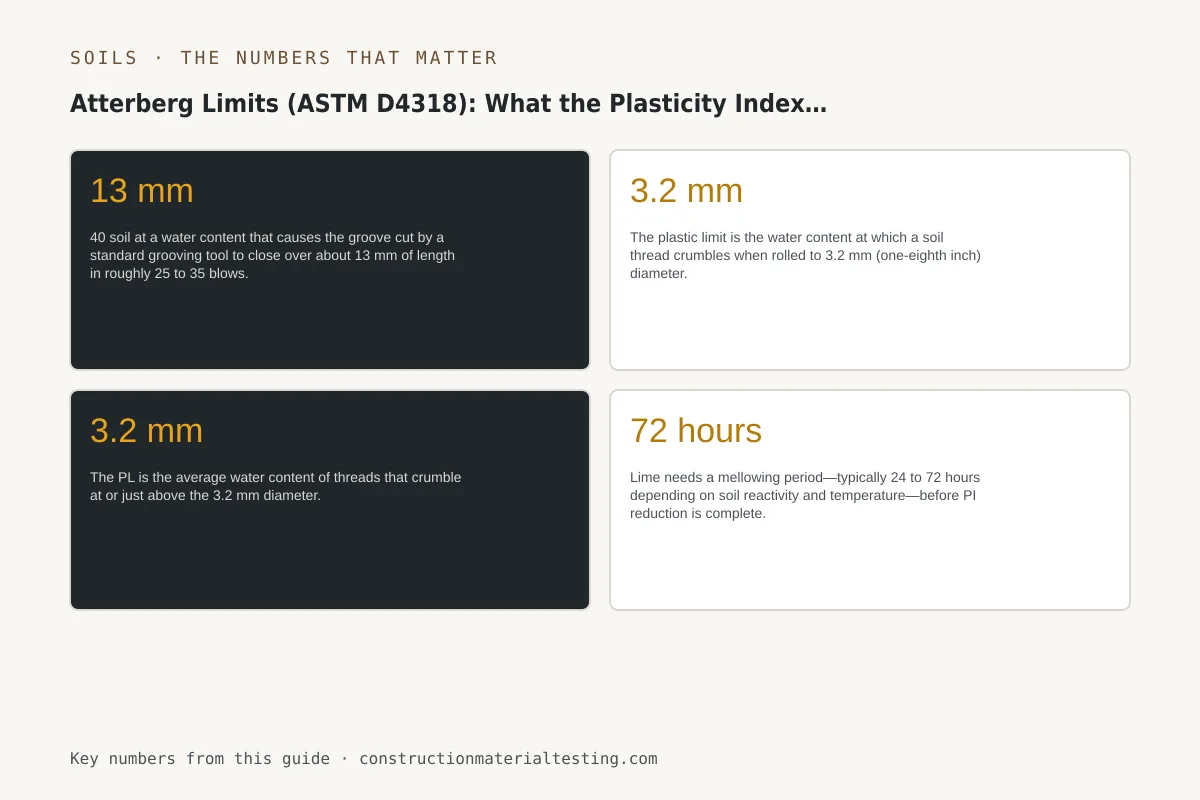
The liquid limit is determined using a Casagrande liquid limit device—a brass cup mounted on a cam that drops it exactly 10 mm onto a hard rubber base when the crank is turned. We prepare a paste of the minus-No. 40 soil at a water content that causes the groove cut by a standard grooving tool to close over about 13 mm of length in roughly 25 to 35 blows. We then adjust the water content and repeat, building a flow curve from at least three data points that bracket the 25-blow target. The water content corresponding to 25 blows is read from that curve and reported as the liquid limit.
ASTM D4318 permits a one-point method when a single test falls between 20 and 30 blows, using a correction factor table built into the standard. We use the multi-point method as a matter of practice for any soil being characterized for a project specification, because the flow curve also tells us something about the soil's sensitivity—a steep curve indicates a soil that changes consistency quickly with small water-content shifts, which matters when you are trying to hit a compaction window in the field. The precision statement in ASTM D4318 places single-operator repeatability for the liquid limit at roughly ±1.5 percentage points, so results reported to the nearest whole number are appropriate; false precision beyond that is not warranted.
One practical note for contractors: the liquid limit specimen is prepared from air-dried or field-moist material, and the test is run on material passing the No. 40 sieve only. If your borrow material contains significant gravel or coarse sand, those fractions are removed before testing. The LL result therefore describes only the fine fraction. When the fine fraction represents a small portion of the total soil, the PI of the whole material may be effectively lower—but that is a USCS classification judgment, not a reason to ignore a high LL on the fines themselves.
Rolling Threads: How Plastic Limit Is Determined
The plastic limit is the water content at which a soil thread crumbles when rolled to 3.2 mm (one-eighth inch) diameter. The procedure is straightforward but technique-dependent: a technician rolls a ball of prepared soil between the palm and a glass plate, reducing the thread diameter with each pass. The PL is the average water content of threads that crumble at or just above the 3.2 mm diameter. ASTM D4318 requires at least two determinations that agree within acceptable tolerance. The test sounds simple, but the rolling pressure, the speed, and the judgment of when a thread has truly crumbled rather than merely bent or flattened all affect repeatability—which is why ASTM D4318's between-laboratory reproducibility for PL is wider than for LL.
The plasticity index is then simply PI = LL − PL. If a soil cannot be rolled into a thread at any water content—because it is too sandy or silty to cohere—it is reported as non-plastic (NP). An NP result tells you the soil lacks significant clay mineralogy, which usually means low shrink-swell potential but also limited cohesion. For materials testing services on earthwork projects, we routinely run LL, PL, and PI together as a single reported result; separating them without context invites misinterpretation.
Reading the Plasticity Chart and ASTM D4318 Results
Once LL and PI are in hand, we plot the result on a plasticity chart—LL on the horizontal axis, PI on the vertical axis. The A-line (PI = 0.73 × (LL − 20)) divides clays above the line from silts and organic soils below it. The U-line defines an upper boundary that well-characterized soils rarely exceed. This chart is central to the ASTM D2487 Unified Soil Classification System, which uses the plot position combined with gradation data to assign a symbol like CL, CH, ML, or MH. That symbol then travels through the geotechnical report, the earthwork specification, and the inspector's acceptance criteria.
A CL soil (lean clay, plots above A-line, LL less than 50) is common across much of the Houston suburban belt. A CH soil (fat clay, LL 50 or above) is more problematic—these are the black clays that crack and heave seasonally. MH soils (elastic silt) are less common in this region but appear in some flood-plain deposits; they can be deceptively dangerous because they plot below the A-line and may be mistaken for less hazardous material. The chart position is not just a label—it predicts field behavior well enough that experienced geotechnical engineers can read a plasticity chart and immediately understand shrink-swell risk, trafficability concerns, and stabilization requirements without additional narrative.
For contractors, the most actionable read from the plasticity chart is simply the PI number and where it falls relative to your specification's threshold. Most project specs do not require you to interpret chart position—they just cap PI. But understanding why that cap exists helps field decisions when borderline material shows up.
How PI Predicts Shrink-Swell and Why Fill Specs Cap It
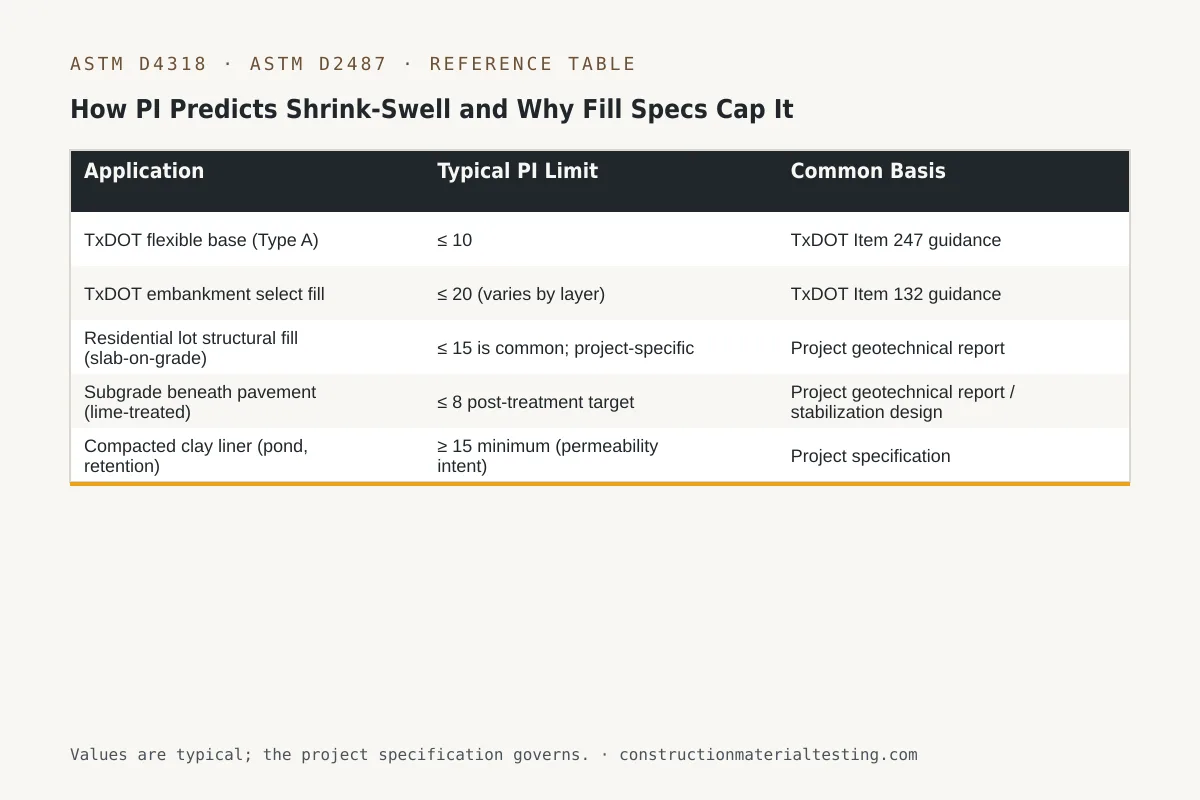
Shrink-swell movement in fine-grained soils is driven by the clay mineral content and surface area available to attract and release water molecules. Montmorillonite, the dominant clay mineral in many Texas Gulf Coast soils, has an enormous internal surface area and a strong affinity for water—which is why CH clays in this region can swell several percent volumetrically with seasonal rainfall. PI correlates well with this behavior because both PI and swell potential are functions of the same clay mineralogy. A soil with PI of 35 will generally swell more and shrink more than one with PI of 12, all else equal.
Select fill and controlled structural fill specifications cap PI precisely to manage this risk. The table below shows representative PI limits from common project specification types used in this region. These are reference ranges drawn from published agency guidance and standard geotechnical practice; always defer to your project's geotechnical report and specification of record.
When fill is rejected for exceeding a PI limit, contractors sometimes ask whether they can blend the material with a lower-PI borrow to bring the average down. Blending can work, but the resulting blend must be tested—you cannot average PI values mathematically the way you might average gradation data, because PI is nonlinear with clay content. The blended material must be sampled and re-tested through the full ASTM D4318 procedure to confirm compliance.
| Application | Typical PI Limit | Common Basis |
|---|---|---|
| TxDOT flexible base (Type A) | ≤ 10 | TxDOT Item 247 guidance |
| TxDOT embankment select fill | ≤ 20 (varies by layer) | TxDOT Item 132 guidance |
| Residential lot structural fill (slab-on-grade) | ≤ 15 is common; project-specific | Project geotechnical report |
| Subgrade beneath pavement (lime-treated) | ≤ 8 post-treatment target | Project geotechnical report / stabilization design |
| Compacted clay liner (pond, retention) | ≥ 15 minimum (permeability intent) | Project specification |
Lime Treatment: Using Atterberg Limits to Confirm Stabilization
Lime stabilization works by driving a pozzolanic reaction between calcium from the lime and alumina and silica from the clay minerals, forming cementitious compounds that permanently reduce plasticity. The immediate effect—observable within 24 to 48 hours of mixing—is a drop in PI driven by flocculation and cation exchange, which stiffens the soil enough to improve trafficability. The long-term strength gain comes from the slower pozzolanic reaction, but from a specification standpoint, the PI reduction is the primary acceptance criterion before or alongside compaction.
A typical lime treatment design targets a PI reduction of at least 5 to 10 points from the natural soil value, often bringing a CH soil from PI 35–45 down to PI 12 or below after treatment. The geotechnical engineer specifies a lime rate (commonly 4–8 percent by dry weight of soil) based on initial Atterberg limits and mellowing-period testing. We then run post-treatment Atterberg limits on laboratory-prepared specimens at the design lime rate to confirm the target is achievable before field operations begin. Field verification follows—samples taken from the mixed, mellowed subgrade are tested again before compaction begins.
One thing contractors encounter frequently on lime-stabilization projects is the temptation to compact too soon. Lime needs a mellowing period—typically 24 to 72 hours depending on soil reactivity and temperature—before PI reduction is complete. Compacting immediately after mixing locks in higher plasticity and can crack the treated layer when the long-term pozzolanic reaction continues under load. The Atterberg limits test run at the right time is the confirmation that mellowing is finished and the soil is ready to accept compaction effort effectively.
Where This Fits on Your Project
For a contractor, the Atterberg limits test is most valuable early—before you commit to a borrow source, before you finish grading, and before lime treatment begins. Running the test at the source lets you screen material against your spec before hauling it to the site. Running it after lime treatment confirms the stabilization chemistry worked before you compact and cover. Running it on native subgrade before slab placement gives the structural engineer the data needed to evaluate whether post-tensioning or void form depths need adjustment for local soil conditions.
Our laboratory team and field technicians handle the full sequence: sampling, preparation, multi-point liquid limit testing, plastic limit rolling, and reporting with the plasticity chart position for USCS classification under ASTM D2487. Results are reviewed against the project specification and geotechnical report before the report is issued, so the contractor and engineer of record receive a result with clear context, not just a number. If you have a borrow source to qualify, a subgrade to characterize, or a lime-treatment program to verify, submit a proposal request and we will put the right testing sequence together for your schedule.
Get our guides in your Google results
Add Construction Materials Testing as a preferred source and Google shows our guides more often when you search for testing topics.