
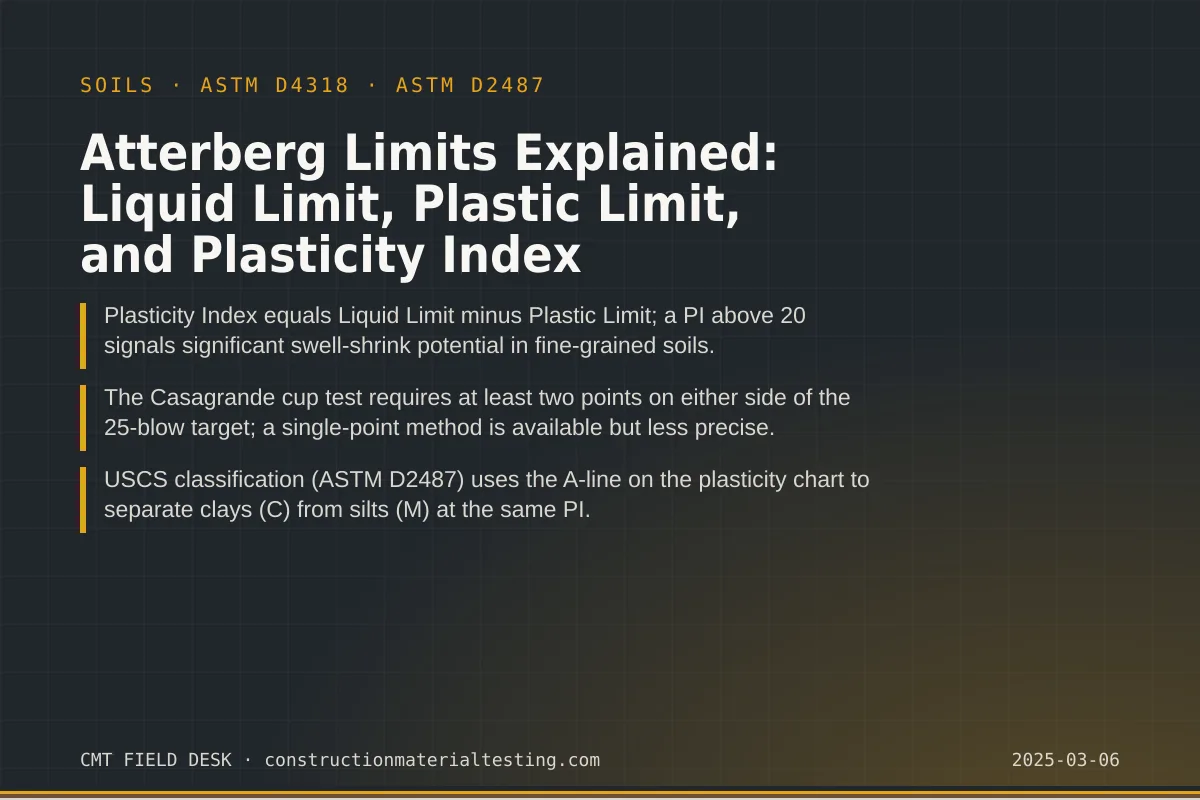
What Atterberg Limits Actually Measure
Atterberg limits describe the moisture contents at which a fine-grained soil transitions between distinct behavioral states. At very high moisture content, soil flows like a viscous liquid. As it dries, it stiffens into a plastic, moldable mass. Drying further, it becomes brittle and semi-solid. The liquid limit (LL) marks the boundary between plastic and liquid behavior; the plastic limit (PL) marks the boundary between plastic and semi-solid behavior. The difference between those two values is the plasticity index (PI), and it is the single most useful number that comes out of the test.
These limits apply only to the fine-grained fraction of a soil — specifically, the material passing the No. 40 sieve. Gravel and coarse sand do not exhibit plasticity. This is why Atterberg limits are the diagnostic tool for clays and silts, and why they sit at the center of the Unified Soil Classification System. A coarse-grained soil classified under ASTM D2487 may still require Atterberg limits on its fines fraction if the fines content exceeds a threshold that affects engineering behavior.
The shrinkage limit — a third Atterberg value — marks the moisture content below which further drying no longer reduces soil volume. It is rarely specified on routine construction projects but becomes relevant when evaluating volumetric change in highly expansive clays or when designing for drought conditions. Most laboratory work and most geotechnical specifications reference only LL, PL, and PI, so that is where we focus here.
Running the Liquid Limit Test (Casagrande Cup Procedure)
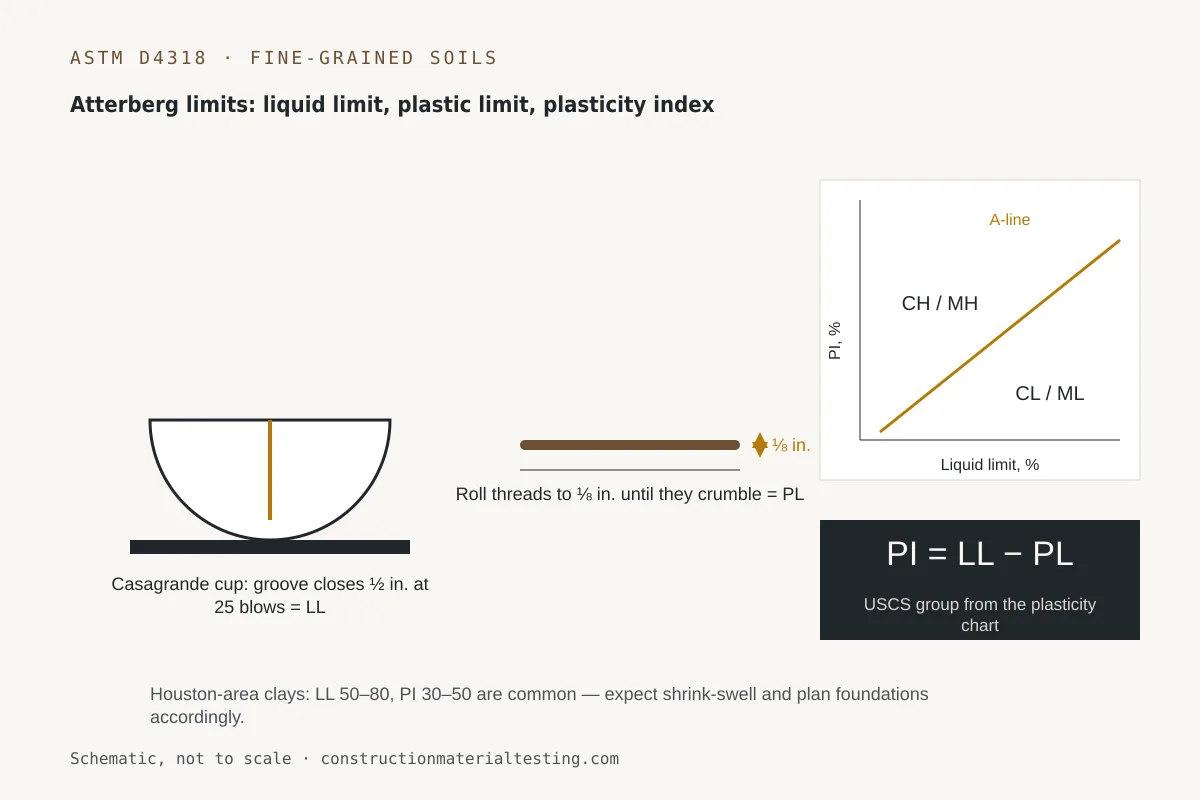
The ASTM D4318 liquid limit procedure begins with soil preparation. We take a representative sample of the fraction passing the No. 40 sieve and bring it to a uniform paste near the expected liquid limit using distilled water. The sample rests in a covered container for at least 16 hours when using the wet preparation method, allowing moisture to equilibrate through the mass. Dry preparation — starting from an air-dried specimen — is permitted but can produce different results in some soils, so the geotechnical engineer of record should specify which method applies.
We place a portion of the paste into the Casagrande cup, level it to a depth of about 10 mm at the deepest point, and draw the grooving tool through the center of the pat. The cup is then cranked at approximately two drops per second. We count the number of blows required for the groove to close over a length of 13 mm (one-half inch). That blow count and the moisture content of a specimen taken from the closed portion go together as one data point. We repeat the test at three or more moisture contents bracketing 25 blows — ideally with at least two points below 25 blows and two above — and plot blow count on a log scale against moisture content. The moisture content corresponding to 25 blows, read from the flow curve, is the liquid limit.
ASTM D4318 also permits a one-point liquid limit method when the blow count falls between 20 and 30. A correction factor adjusts the measured moisture content to the equivalent 25-blow value. The multipoint method is more reliable, especially for soils with a steep or irregular flow curve, and we default to it on projects where the LL drives a classification or a specification acceptance decision.
Running the Plastic Limit Test (Thread Rolling)
The plastic limit test is simpler in equipment but demands consistent technique. We take a small ball of soil — roughly 8 grams — and roll it between our palm and a glass plate (or a smooth non-absorbent surface) using light, even pressure. The goal is to roll the thread down to a diameter of 3.2 mm (approximately one-eighth inch). At moisture contents above the plastic limit, the thread will reach 3.2 mm without crumbling. We re-knead the thread, reducing moisture slightly with each cycle, and repeat until the thread begins to crack and crumble just as it reaches 3.2 mm in diameter. That crumbling point is the plastic limit.
We immediately weigh the crumbled thread pieces and dry them at 110 ± 5 °C to determine moisture content. ASTM D4318 requires at least two determinations that agree within a tolerance specified in the standard; we average them. The technique matters more than most technicians appreciate. Rolling too hard — pressing the thread against the plate rather than rolling it — drives moisture out mechanically and produces an artificially low PL. Rolling too lightly lets the thread survive at diameters larger than 3.2 mm, inflating the PL. Both errors shift the PI and can misclassify a soil.
Computing PI and Reading the Plasticity Chart — Atterberg Limits in Classification
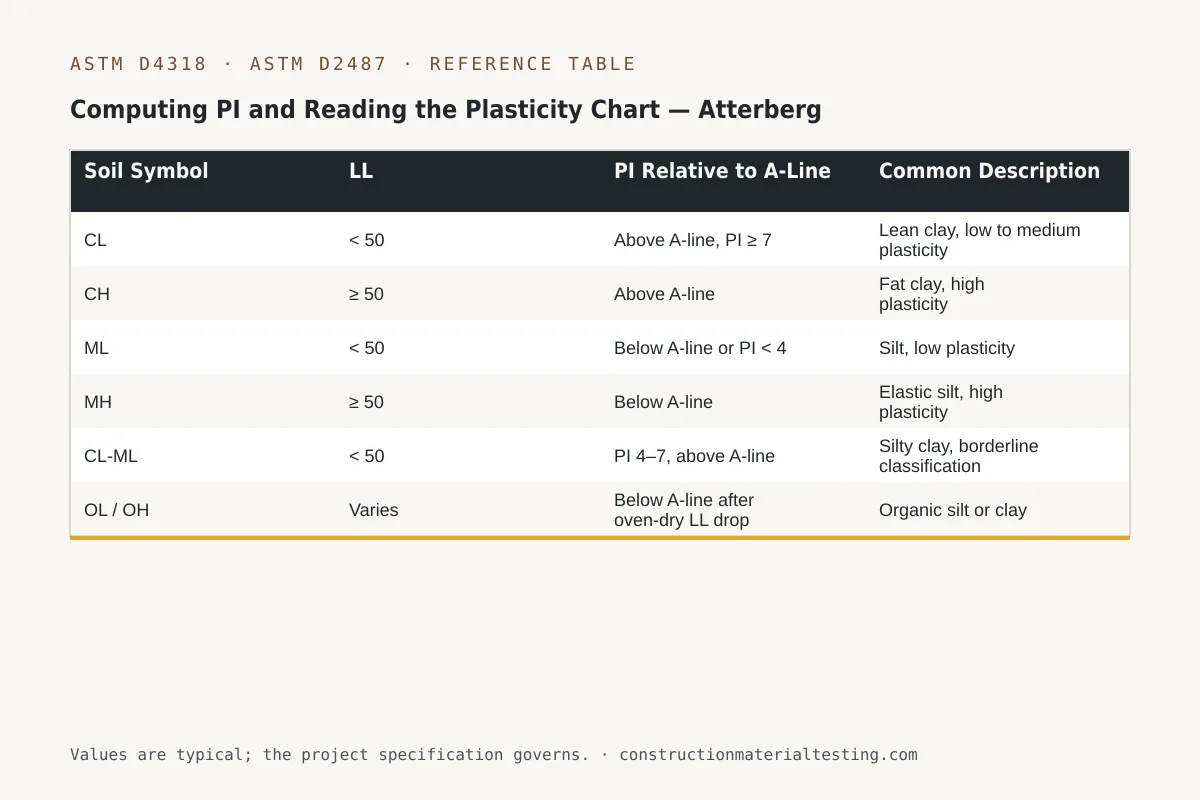
Once LL and PL are in hand, PI is arithmetic: PI = LL − PL. A soil with LL = 52 and PL = 24 has PI = 28. That number alone tells you the soil has meaningful swell-shrink potential, but classification under ASTM D2487 requires plotting the result on the plasticity chart. The chart has PI on the vertical axis and LL on the horizontal axis. Two lines divide the space: the A-line, with equation PI = 0.73(LL − 20), separates clays (plotting above the line) from silts (plotting below); and the vertical line at LL = 50 separates low-plasticity (L) from high-plasticity (H) soils.
Soils plotting above the A-line with LL < 50 are classified CL (lean clay); above the A-line with LL ≥ 50 are CH (fat clay). Below the A-line with LL < 50 are ML (silt); below with LL ≥ 50 are MH (elastic silt). The hatched zone near LL = 50 and the region near PI < 4 or below the A-line at low LL define soils that can carry either classification depending on index tests and visual-manual description. This is also where organic soils (OL, OH) enter the picture — organics typically show a drop in LL after oven drying, which is a separate determination described in ASTM D4318.
| Soil Symbol | LL | PI Relative to A-Line | Common Description |
|---|---|---|---|
| CL | < 50 | Above A-line, PI ≥ 7 | Lean clay, low to medium plasticity |
| CH | ≥ 50 | Above A-line | Fat clay, high plasticity |
| ML | < 50 | Below A-line or PI < 4 | Silt, low plasticity |
| MH | ≥ 50 | Below A-line | Elastic silt, high plasticity |
| CL-ML | < 50 | PI 4–7, above A-line | Silty clay, borderline classification |
| OL / OH | Varies | Below A-line after oven-dry LL drop | Organic silt or clay |
What High PI Means for Houston Expansive Clays and Your Project
The Gulf Coast region — including the Houston and Sugar Land corridor — is underlain in large part by Beaumont Clay and related Pleistocene-age deposits. These soils routinely produce liquid limits between 60 and 80 and plasticity indices between 40 and 60, placing them firmly in the CH category on the plasticity chart. The ASCE Geo-Institute and regional geotechnical practice both recognize that soils in this PI range can generate differential heave measured in inches when they cycle through wet and dry seasons — a pattern that is not hypothetical in Southeast Texas.
For pavement design, a high-PI subgrade means the modulus of subgrade reaction drops sharply when the soil is wet. Engineers specify lime or cement stabilization precisely to drive the PI down — lime treatment can reduce PI by 20 or more points by exchanging calcium ions with clay minerals and forming cementitious compounds at the contact surfaces. Many TxDOT projects specify a treated PI target of 20 or less before placing base course. Atterberg limits on both untreated and treated specimens are part of the quality verification sequence.
For foundation design on expansive clays, the PI feeds directly into estimates of the potential vertical rise (PVR) or swell potential. Structural engineers sizing post-tensioned slabs — the dominant foundation type for residential and light commercial construction in the Houston metro — need PI data across the active zone depth to estimate differential movement. Without measured Atterberg limits, that estimate is a guess. Our geotechnical services routinely include Atterberg limits as a standard deliverable in boring programs precisely because the design team cannot responsibly skip that data in this geology.
Common Errors That Corrupt Results
Atterberg limits are straightforward tests, but several sources of error appear regularly. The most common in the liquid limit test is a worn or improperly adjusted Casagrande cup. ASTM D4318 specifies that the cup should drop 10 ± 0.2 mm; a cup dropping 11 mm will close the groove at a higher blow count than the true liquid limit, skewing LL upward. We check the drop height at the start of every test session using the gauge on the grooving tool handle. Cups also develop wear on the contact point over time and must be replaced when the brass shows visible deformation.
In the plastic limit test, the most common error is using a surface that absorbs moisture — a wood table, an old piece of tile, or any porous material. ASTM D4318 requires a ground glass plate or a similar non-absorbent surface. Absorbent surfaces pull moisture from the thread and produce plastic limits that are too low, compressing the PI. We also see errors when technicians fail to knead the thread sufficiently between passes, which means they are not actually reducing moisture content and the crumbling point never arrives cleanly.
Sample preparation is another underappreciated variable. Soils that are allowed to dry below the plastic limit before testing, then rewetted, may not re-hydrate the clay minerals to their natural state. The ASTM D4318 standard addresses this by describing both wet and dry preparation methods and noting that dry preparation is not appropriate for all soils. When project specifications or the geotechnical engineer require wet preparation, we document that on the test record.
Where This Fits on Your Project
Atterberg limits testing is typically specified in the geotechnical investigation scope before design, in quality control plans for earthwork and subgrade preparation, and in pavement stabilization verification programs. If you are submitting soil samples for classification under ASTM D2487, Atterberg limits on the fine-grained fraction are almost always part of the same submittal. Our laboratory processes samples under a documented quality system, and our field technicians — ACI- and NICET-certified — can coordinate sampling with your boring contractor or take disturbed samples directly from excavations.
If you are working through a project specification and need to confirm which tests apply at which phases, or if you need Atterberg limits as part of a subgrade stabilization approval sequence, reach out through our proposal request page and describe the soil type, project location, and the specification reference. We will put together a scope that matches what the design team actually needs.
Get our guides in your Google results
Add Construction Materials Testing as a preferred source and Google shows our guides more often when you search for testing topics.